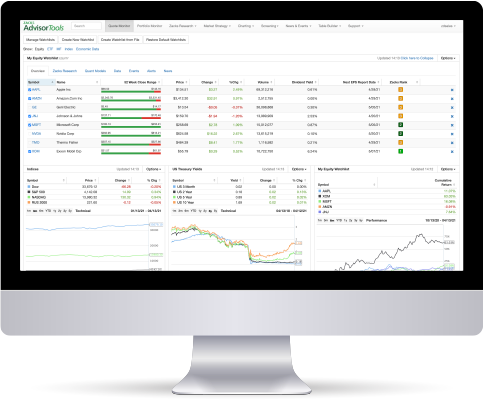
What this page tells you:
This page presents charts showing the history of key financial ratios used by most advisors to determine the investment attractiveness of a company.
Charts to the right show the history of Surprises
Charts below show the history of Valuation and other key ratios
To view the history of a ratio, click on the name of the ratio or on the chart icon to the right of the ratio value.
No charge | No obligation | No credit card
Explore award winning Zacks research plus our powerful analytic tools, including advanced charting, equity screening, backtesting, and much more.
Important Update for Zacks Advisor Tools Clients.
Access to Zacks Investment Management Model Portfolios is available with your subscription
Explore the Zacks Investment Management Model Portfolios and enhance your investment strategy.
Please contact Jake Conger for access.
312-265-9224
Jconger@zacksim.com
Or, schedule a time.
https://calendly.com/jconger-zacksim/30min